

Bitcoin (BTC) is on a six-month bear market, down-trending from March’s $73,800 all-time high to as low as $49,100, but this trend could shift as signals of a bull run surge on the horizon.
Recently, different analysts have commented on a clear Bitcoin price downtrend made of lower highs and lower lows.
Alan Santana mentioned how charts are mostly bearish, later setting his target at $40,000, warning of a crash. Credible Crypto shared a similar yet more optimistic stance, saying Bitcoin is not out of the woods – requiring a shift.
This shift, however, appears to be nearing, according to two analyses that have spotted bullish indicators on BTC’s price charts. Essentially, these technical indicators suggest the bear trend could soon pivot in the following days or weeks, starting a rally.
Trend shift: The bull case for Bitcoin amid bearish sentiment
First, Babenski called for the trend shift after Bitcoin made its first higher low from September 6 to 8. This happens after a series of three subsequent lower lows since a first low of $60,700 in March.
The recent price action, up to $64,000, could potentially draw the first higher high amid a series of four lower highs, initiating the trend shift. Moreover, Bitcoin has already broken out of a lower time frame downtrend since the local top on July 29.
If things go as expected, BTC will find validation of this short-term breakout by retesting the downtrend resistance as support. This should happen in a range between $58,000 and $61,000, depending on how long it takes to retrace.
At the time of this analysis, Bitcoin was trading at $63,348 but has already dropped below that level. Babenski also mentioned a triple-bottom formation on BTC’s daily relative strength index (RSI), which measures momentum based on historical performance.
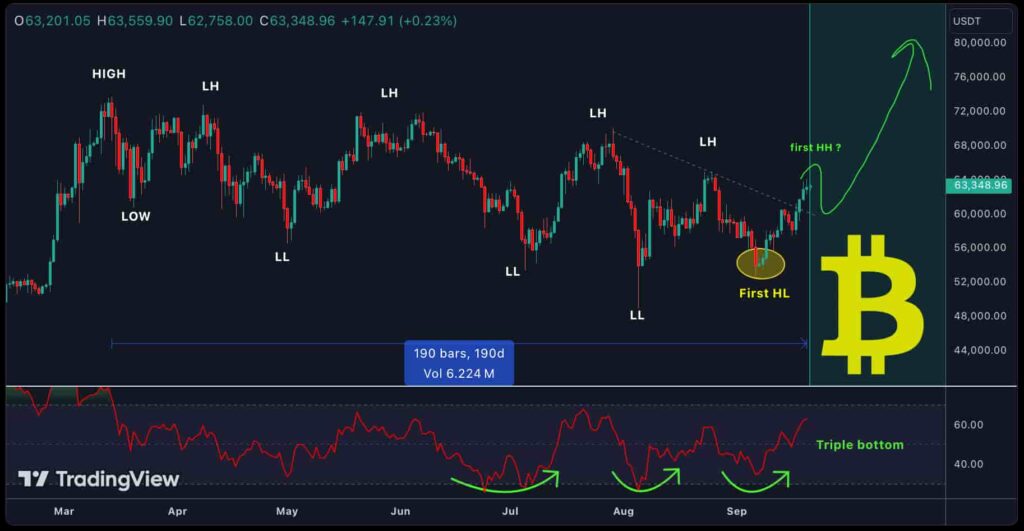
Bitcoin (BTC) daily price chart. Source: TradingView / Babenski
Bitcoin to $130,000 and beyond
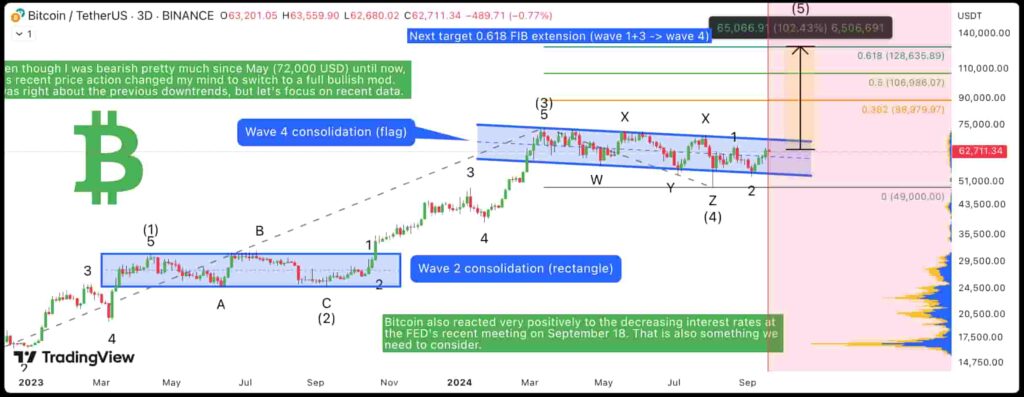
Summing up to this “trend shift” signal, the trader Xanrox believes Bitcoin can soon head to $130,000 per coin. Notably, Xanrox has just shifted his perception after holding a bearish bias since May. Finbold reported the analyst warning of a “huge bear market starting” on September 11.
This pivot has raised some tough criticisms in the comment section of his most recent idea shared on TradingView, with critics negatively pointing out the change. Nevertheless, he explained that traders and investors must be able to change their perceptions according to indicators and trend shifts.
Meanwhile, Van Eck CEO Jan van Eck forecasted Bitcoin could eventually reach $350,000 during an interview for Fox Business. This would happen if the leading cryptocurrency achieves half the market capitalization of gold, the leading commodity.
“What I’m saying is Bitcoin is growing up and will eventually be half the total market cap of gold and that’s about $350,000.”
– Jan van Eck, on Fox Business
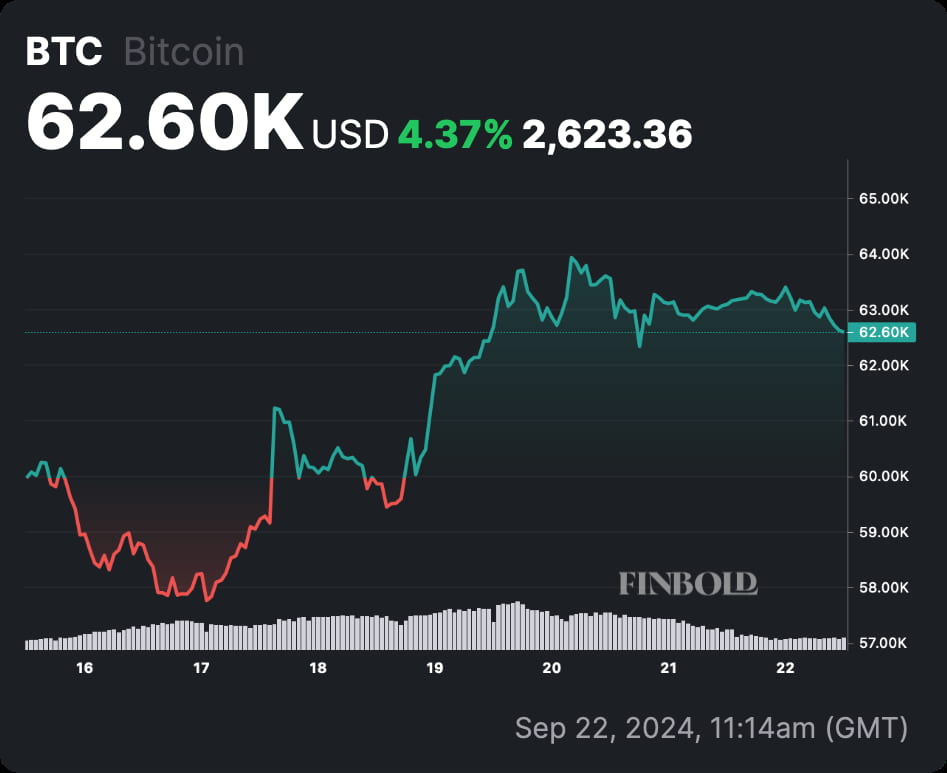
As of this writing, Bitcoin trades at $62,600, up 4.37% in the last seven days. BTC heads to test the trend shift support for validation, which can define the cryptocurrency’s move in the following days.
Interestingly, a crypto commentator on X recently pointed out that we are entering a phase in the market that will reward “dumb bulls” more than “smart bears,” suggesting it may be time to consider positioning for a Bitcoin trend shift, eyeing higher highs and higher lows.
Disclaimer: The content on this site should not be considered investment advice. Investing is speculative. When investing, your capital is at risk.
The post Is a Bitcoin bull run on the horizon? Analysts signal trend shift appeared first on Finbold.