
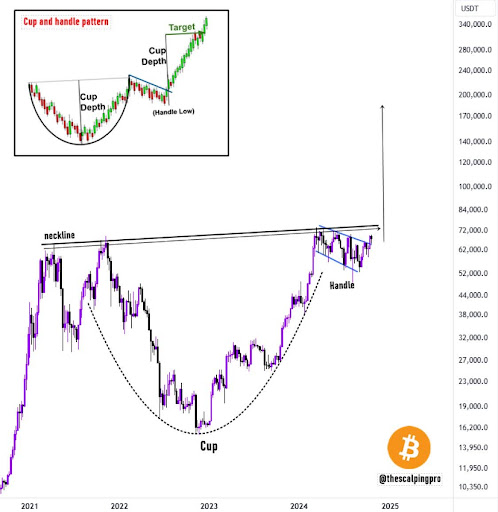
The Bitcoin price could see its price surging dramatically to $200,000, with the formation of a new Cup and Handle pattern. While the pioneer cryptocurrency has been slowly recovering from bearish trends to reach the $70,000 mark, a rally to $200,000 would mark a historical milestone and a new All-Time-High (ATH) for BTC.
Technical Pattern Signals $200,000 Rally Ahead
Popular crypto analyst, Mags has unveiled a new technical pattern in the Bitcoin price chart. According to his post on X (formerly Twitter), Bitcoin is currently forming “a massive cup and handle pattern,” indicating a potential for a major rally.
Mags revealed that the Bitcoin price has just moved past the handle portion in the technical pattern, indicating a positive signal for a breakout that could start a bullish phase. As its name suggests, a Cup and Handle pattern is a key technical chart pattern that resembles a cup and handle. In this chart pattern, the cup is in the shape of a U and is considered a bullish signal, while the handle represents a slight downward drift, which indicates a potential buying opportunity to go long.
Mags observed that since Bitcoin has just broken past the handle, the next level is to watch the “neckline” which serves as a resistance point. If Bitcoin can break through the neckline, it’s price could surge dramatically or like the analyst says “go vertical.” This bull rally could see Bitcoin’s price driving towards $200,000, marking a new all time high for the cryptocurrency.
Currently, the price of Bitcoin is trading at $66,972, reflecting a slight 2.02% decrease in the past seven days, according to CoinMarketCap. While Mags has projected a $200,000 price increase for Bitcoin, the analyst has also forecasted even higher price targets in previous X posts, suggesting that a $200,000 price level may be conservative for the world’s first and largest cryptocurrency.
Bitcoin Price Peak Set At $300,000
In another X post on October 24, Mags disclosed that Bitcoin is about to enter its price discovery, suggesting an imminent breakout to new levels. Price discovery is the process by which an asset’s true market value is determined, and for Bitcoin, it suggests when its price could reach fresh highs.
Sharing a historical Bitcoin price chart, the analyst pinpointed instances where the cryptocurrency entered a price discovery before reaching a peak. In 2014, BTC hit a peak, then bottomed out in 2015 before reaching another price high in 2018. A similar price action occurred between 2019 and 2024, with BTC achieving a bottom in 2019 and peaking in 2021.
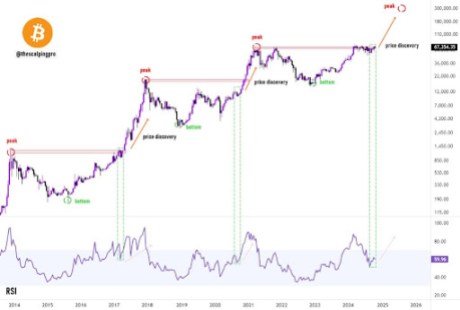
Following this historical price trend, Mags indicated that Bitcoin hit its bottom in 2023 and is now about to enter its price discovery. Once the cryptocurrency does, it could signal a surge to a new all-time high, which Mags has set at an impressive $300,000.