Ripple displayed low market activity, as reflected in its subdued price action for a while before a sudden surge to $2.6 yesterday.
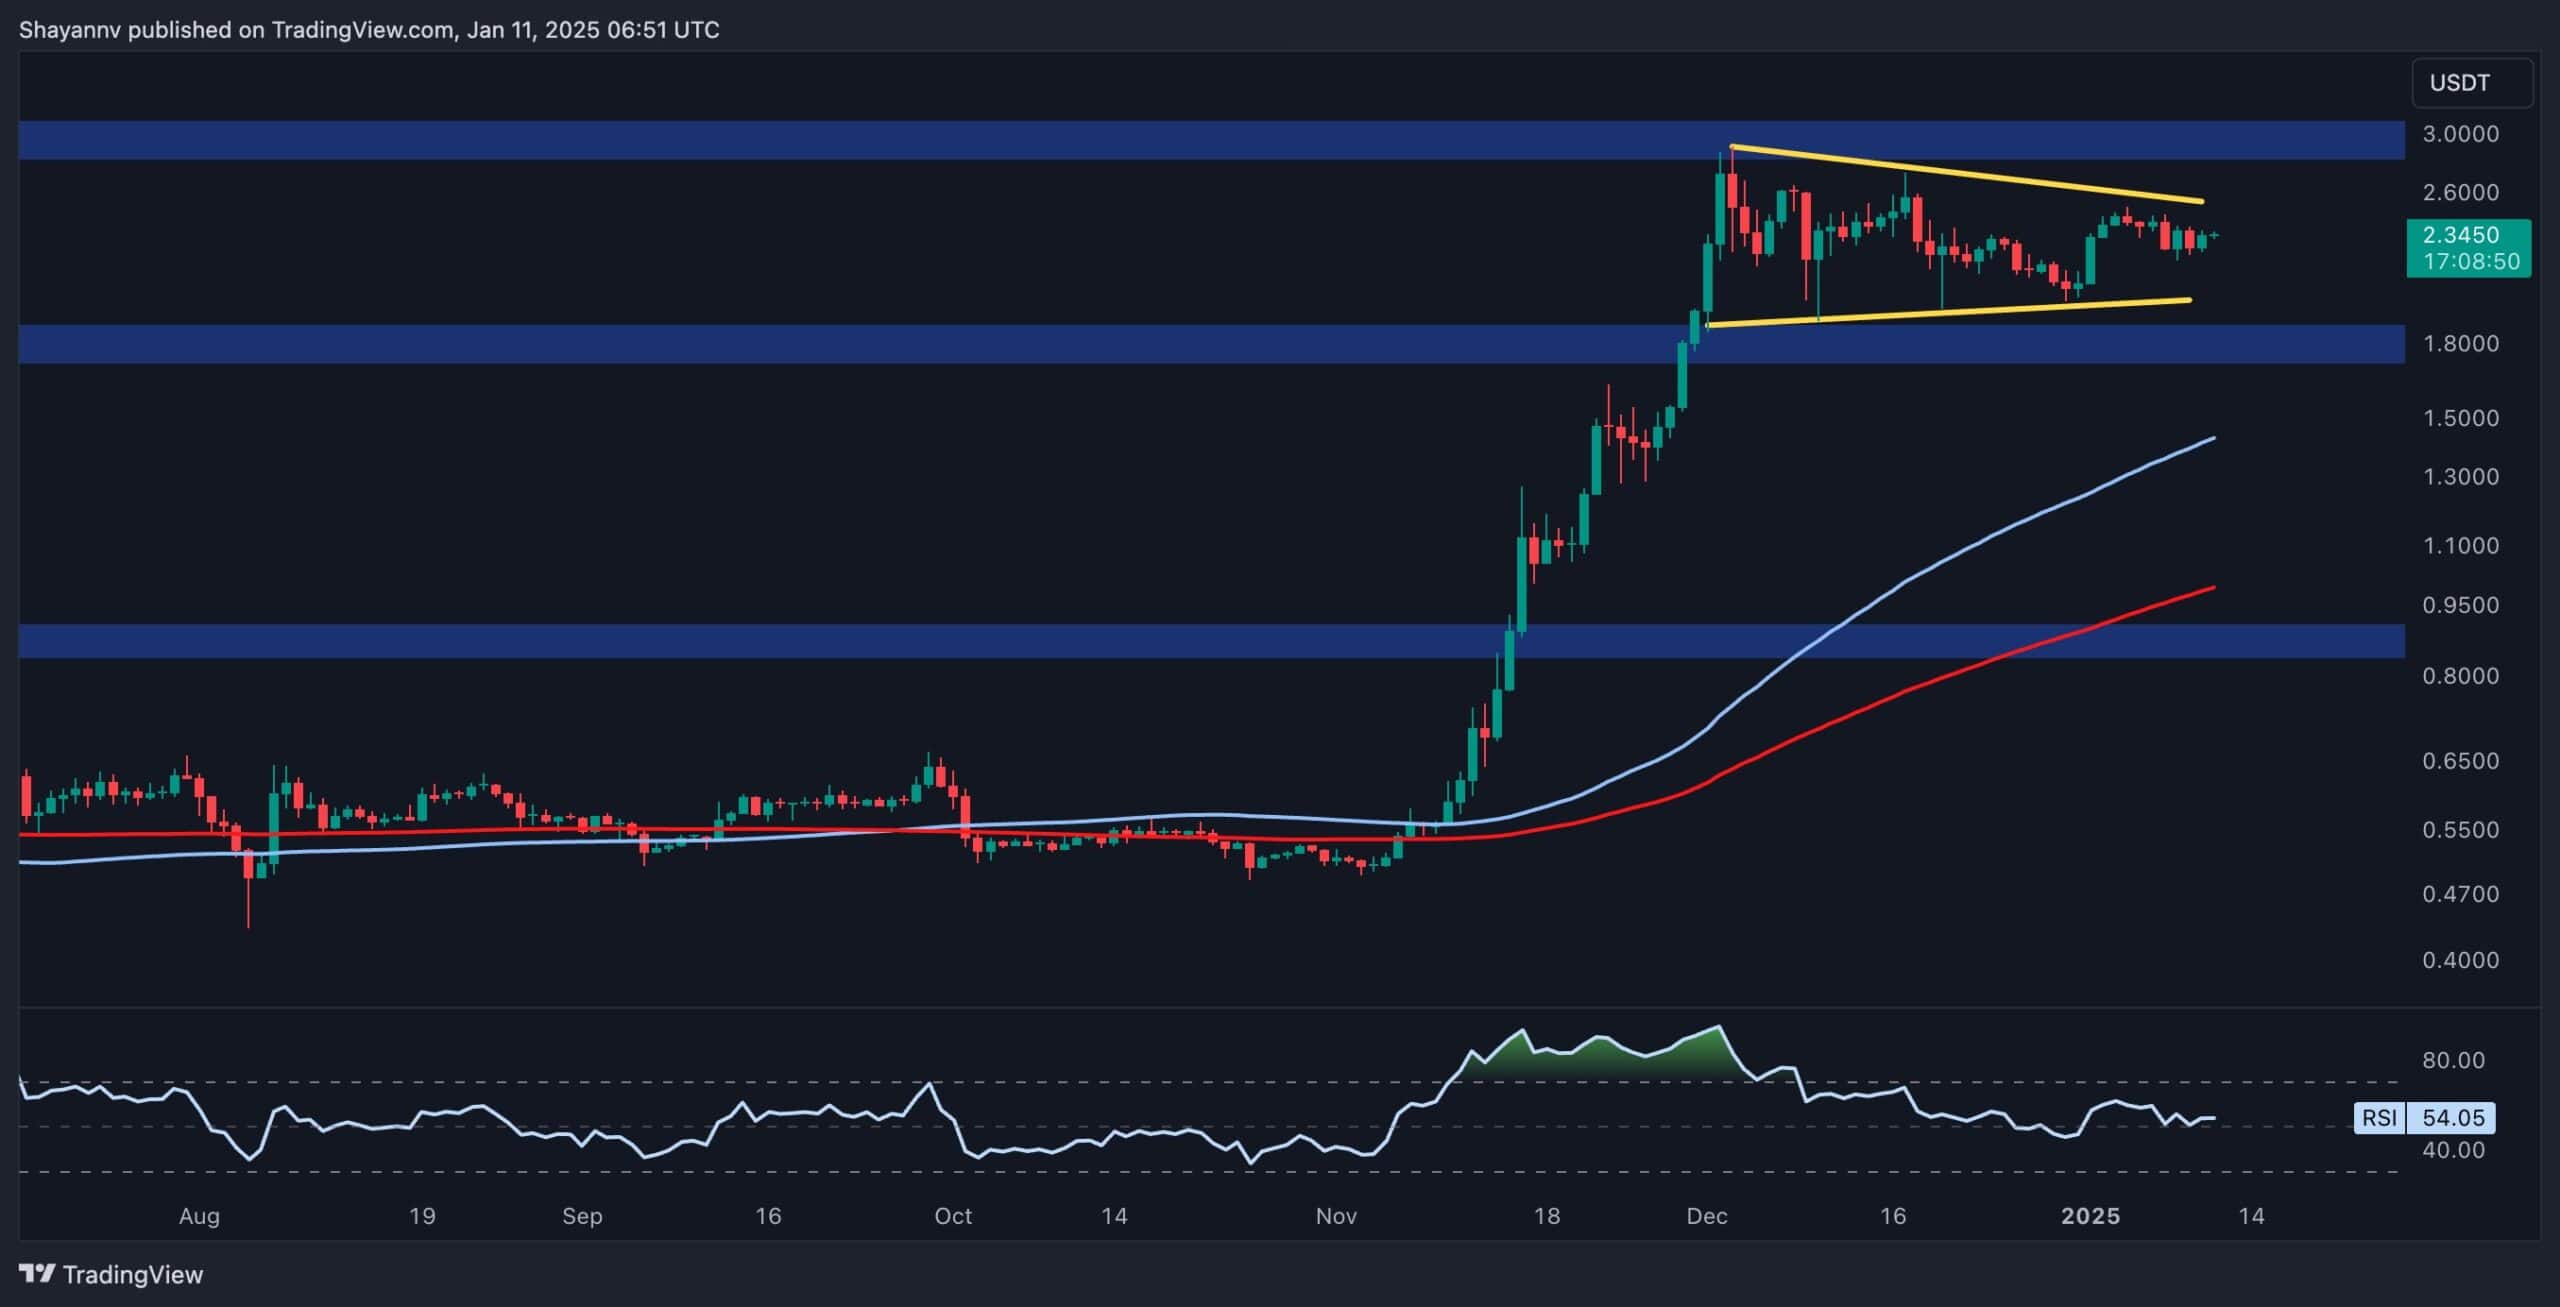
The price remains confined within a sideways wedge pattern, highlighting a phase of consolidation and indecision. A decisive breakout is necessary to establish a sustained market direction.
XRP Analysis
By Shayan
The Daily Chart
Ripple’s current low volatility signals a lack of trading interest, potentially linked to broader macroeconomic factors, such as uncertainty surrounding President Trump’s transition to the White House. XRP’s price remains trapped within a wedge pattern and oscillates in the $2-$3 range even though it jumped to $2.6 yesterday evening.
A breakout from this range is crucial, as it will likely dictate Ripple’s long-term trend. A bullish breakout could trigger a rally, while a bearish breakout may result in significant declines.
The 4-Hour Chart
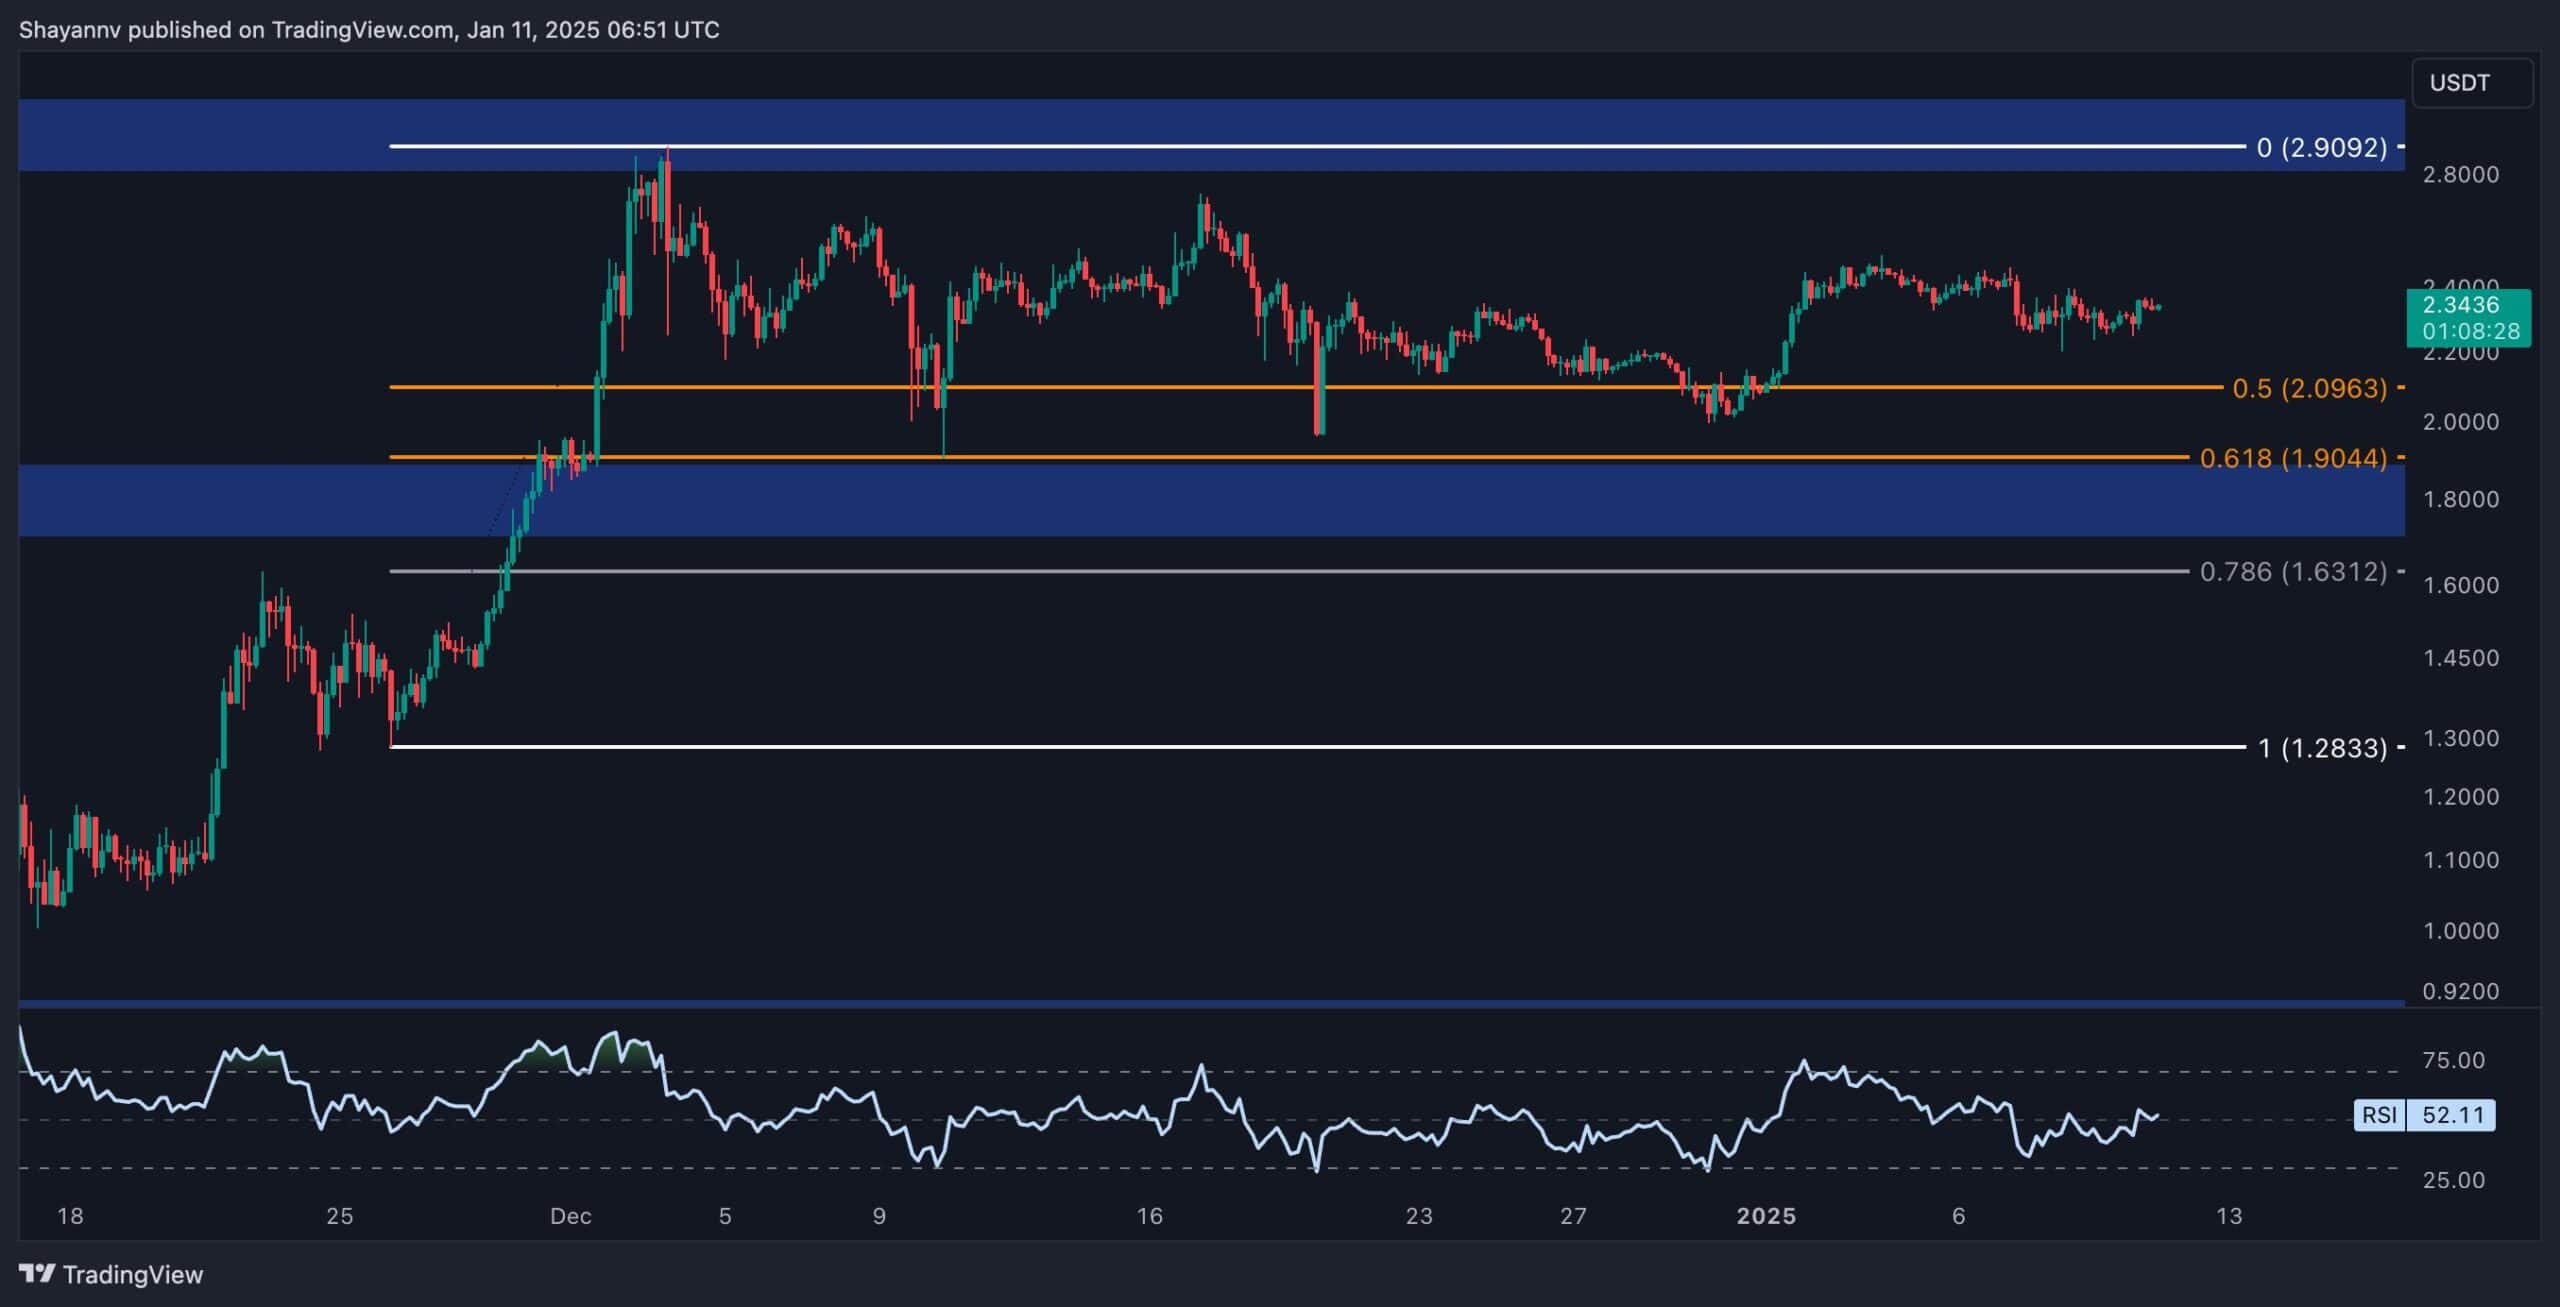
On the 4-hour timeframe, Ripple found support at the 0.5 Fibonacci level ($2), prompting a minor upward move. However, the price has now entered a low volatility phase with no clear directional bias.
Ripple faces significant support near the 0.5 ($2) and 0.618 Fibonacci levels, which have served as strong defenses for buyers in recent months. If buyers manage to defend this region, XRP may experience a bullish spike. However, if sellers push the price below this key support zone, the market could face long liquidations, leading to a substantial decline.
The post Ripple Price Analysis: Can XRP’s Momentum Sustain After 8% Daily Surge? appeared first on CryptoPotato.

