On-chain data shows the Bitcoin Shrimps have been back to accumulation recently as their share of the total supply has risen to 6.9%.
Bitcoin Shrimps Now Buying At A Rate Of 17,600 BTC Per Month
In a new post on X, the on-chain analytics firm Glassnode has discussed about the recent trend in the supply held by the Bitcoin Shrimps. The “Shrimps” refer to the smallest of hands in the BTC market, who carry less than one full token of the cryptocurrency in their wallet balance.
Below is the chart shared by the analytics firm that shows the trend in the Bitcoin Shrimp Supply over the past few years.
From the graph, it’s visible that the Bitcoin Shrimp Supply has registered an increase recently and has reached a value of 1.36 million BTC, which is equivalent to around 6.9% of the entire circulating supply of the asset.
The trend of increase is a new one for the metric, as it was following a downward trajectory earlier. This is more easily visible through the second indicator that Glassnode has attached with the chart: the Shrimp Supply Net Position Change.
This metric keeps track of the net amount of BTC entering into or exiting out of the wallets associated with the Shrimps. As is apparent from the graph, the indicator turned negative last year during the cryptocurrency’s exploration of new all-time highs.
The pattern would imply the Shrimps took some of their profits at the high prices. With BTC shifting towards a bearish trajectory since the top, these investors have decided to resume their accumulation, implying they consider the current prices to be offering a profitable opportunity.
While some may consider the small investors to be behind the curve in the market, they have in fact showed similar smart-money behavior in recent years. Perhaps the most prominent instance of this is their strong accumulation spree that coincided with the bear market lows of 2022.
Since switching back to buying recently, the Net Position Change of the Shrimp Supply has risen to a value corresponding to inflows of 17,600 BTC per month into the wallets of the cohort, which is a significant level.
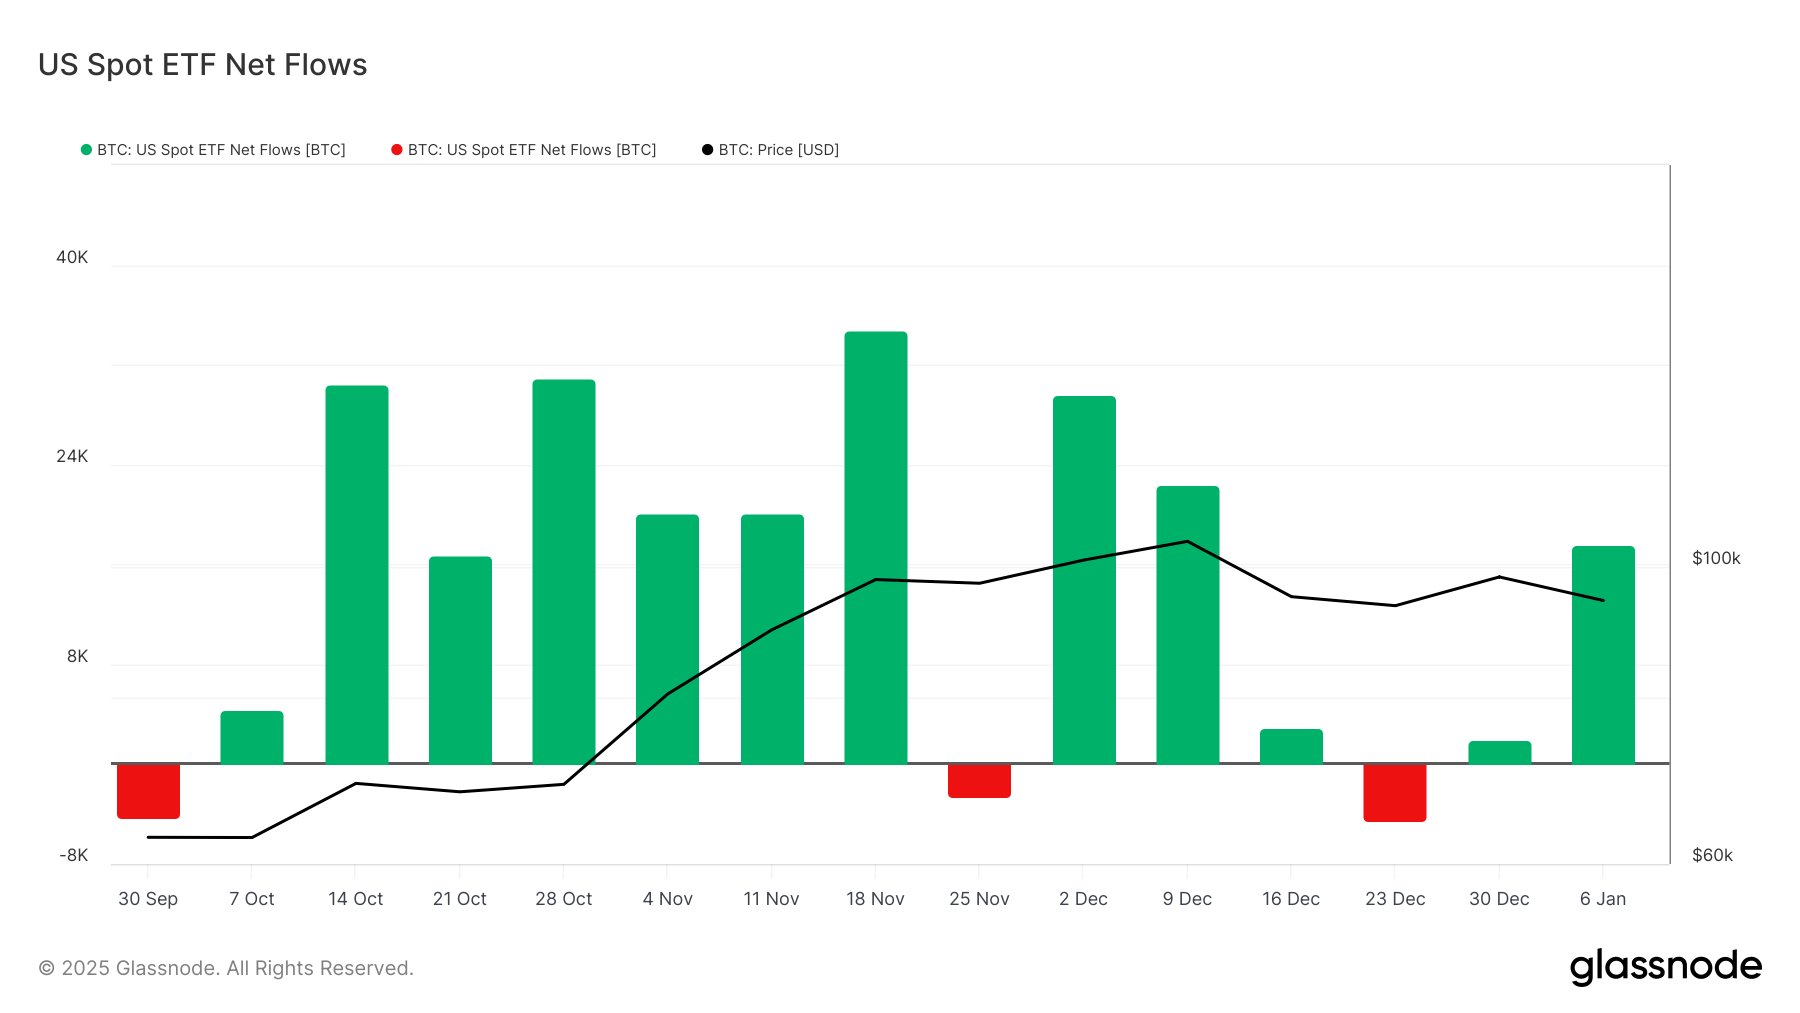
In some other news, the demand for the Bitcoin spot exchange-traded funds (ETFs) has returned during the past week, as the analytics firm has pointed out in another X post.
The Bitcoin spot ETFs started the year with low demand, but in the week starting the 6th of January, inflows reached the $1.7 billion mark, which is higher than the $1.35 billion average that the asset witnessed from October to December of last year.
BTC Price
Bitcoin has continued its recent bearish trend during the past day as its price has now dropped to $91,700.


