Bitcoin’s (BTC) price volatility can offer both long and short opportunities for traders speculating on different time frames. However, an analyst navigated through the BTC price chart, explaining why shorting Bitcoin is not a good idea right now.
In a video uploaded on October 18, CrypNuevo first analyzed Bitcoin in a high (HTF) and low (LTF) time frame. While the LTF is more volatile and could offer some short opportunities for day traders and scalpers, he suggested swing traders avoid opening shorts, as indicators suggest BTC will continue going up.
The analyst also looked at the Bitcoin Dominance Index (BTC.D), marking a 59% dominance by the recording time. We can see Bitcoin was trading at around $68,800 as the video was running.
Do not short Bitcoin in a high time frame
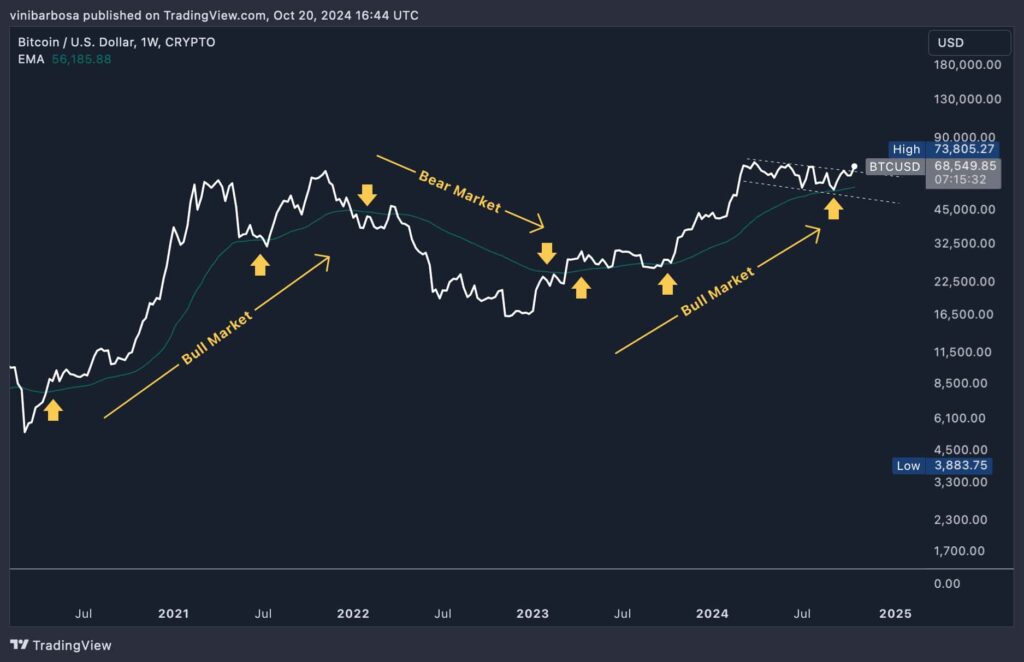
Looking at the weekly and daily price charts, the analyst explained BTC is in an HTF bull market. In particular, CrypNuevo pointed out to the 50-week exponential moving average (1W 50EMA) as a leading indicator of market cycles.
Finbold illustrated the analyst thesis in the weekly price chart, evidencing how the 1W 50EMA clearly indicated each cycle. As observed, breaking out above the line would mark the start of a bull market, while breaking out below it would signal a bear market.
Right now, BTC is strongly trading above the key moving average, which CrypNuevo deemed the main price support moving forward. Therefore, opening a swing trade short position in Bitcoin here would offer poor risk-reward ratios amid bullish HTF momentum.
BTC was trading at $68,550 at the time of publication, slightly down from when the video was recorded.

Bitcoin bullish breakout in lower time frames
The analyst also looked at even lower time frames, for example, with the four- and one-hour price charts. Nevertheless, the most relevant LTF chart will be the one-day frame, considering he posted the video two days ago.
Interestingly, CrypNuevo highlighted a bullish breakout from a seven-month downtrend channel, aligned with what he expected for a channel breakout. According to the analyst, a channel bullish breakout will not happen right after touching the channel’s support.
Actually, his experience forecasted a resistance test followed by a 50% range retracement, setting the path for the breakout. This is precisely what happened in early October, retracing to the middle of the channel, breaking out on October 15.

Bitcoin key levels to watch this week
For this week, CrypNuevo is looking at a key level between $72,000 and $73,800, Bitcoin’s all-time high. According to data he retrieved from Hyblock Capital, this zone is “full of liquidity,” in his words, a likely target.
On the other hand, all this analysis could be invalidated if Bitcoin drops below $64,115, the analyst warned. This would potentially break a key “W” pattern that is impulsing BTC upwards. Moreover, losing this support would also send Bitcoin again inside the downtrend channel, suggesting a fake breakout and bull trap.
Other analysts have made bullish predictions recently, including the previously bearish Alan Santana, now projecting a run above $130,000. Tether’s dollar stablecoin USDT has also reached a $120 billion capitalization, potentially signing an upcoming rally.
As “Uptober” develops, an LTF bull market appears to be back, which creates opportunities to position in altcoins. Finbold reported how indicators suggest an altseason is “just around the corner,” a vision CrypNuevo shares.
“If you are not positioned in altcoins, consider doing so. In the last month, two months, three months, was when I started buying.”
– CrypNuevo
On October 16, the trader M3zee highlighted key BTC.D levels to watch and open altcoin positions or short Bitcoin. Yet, traders and investors should remember that the market is volatile, and even the most prominent analysts can make mistakes.
The post Analyst explains why not short Bitcoin right now appeared first on Finbold.

