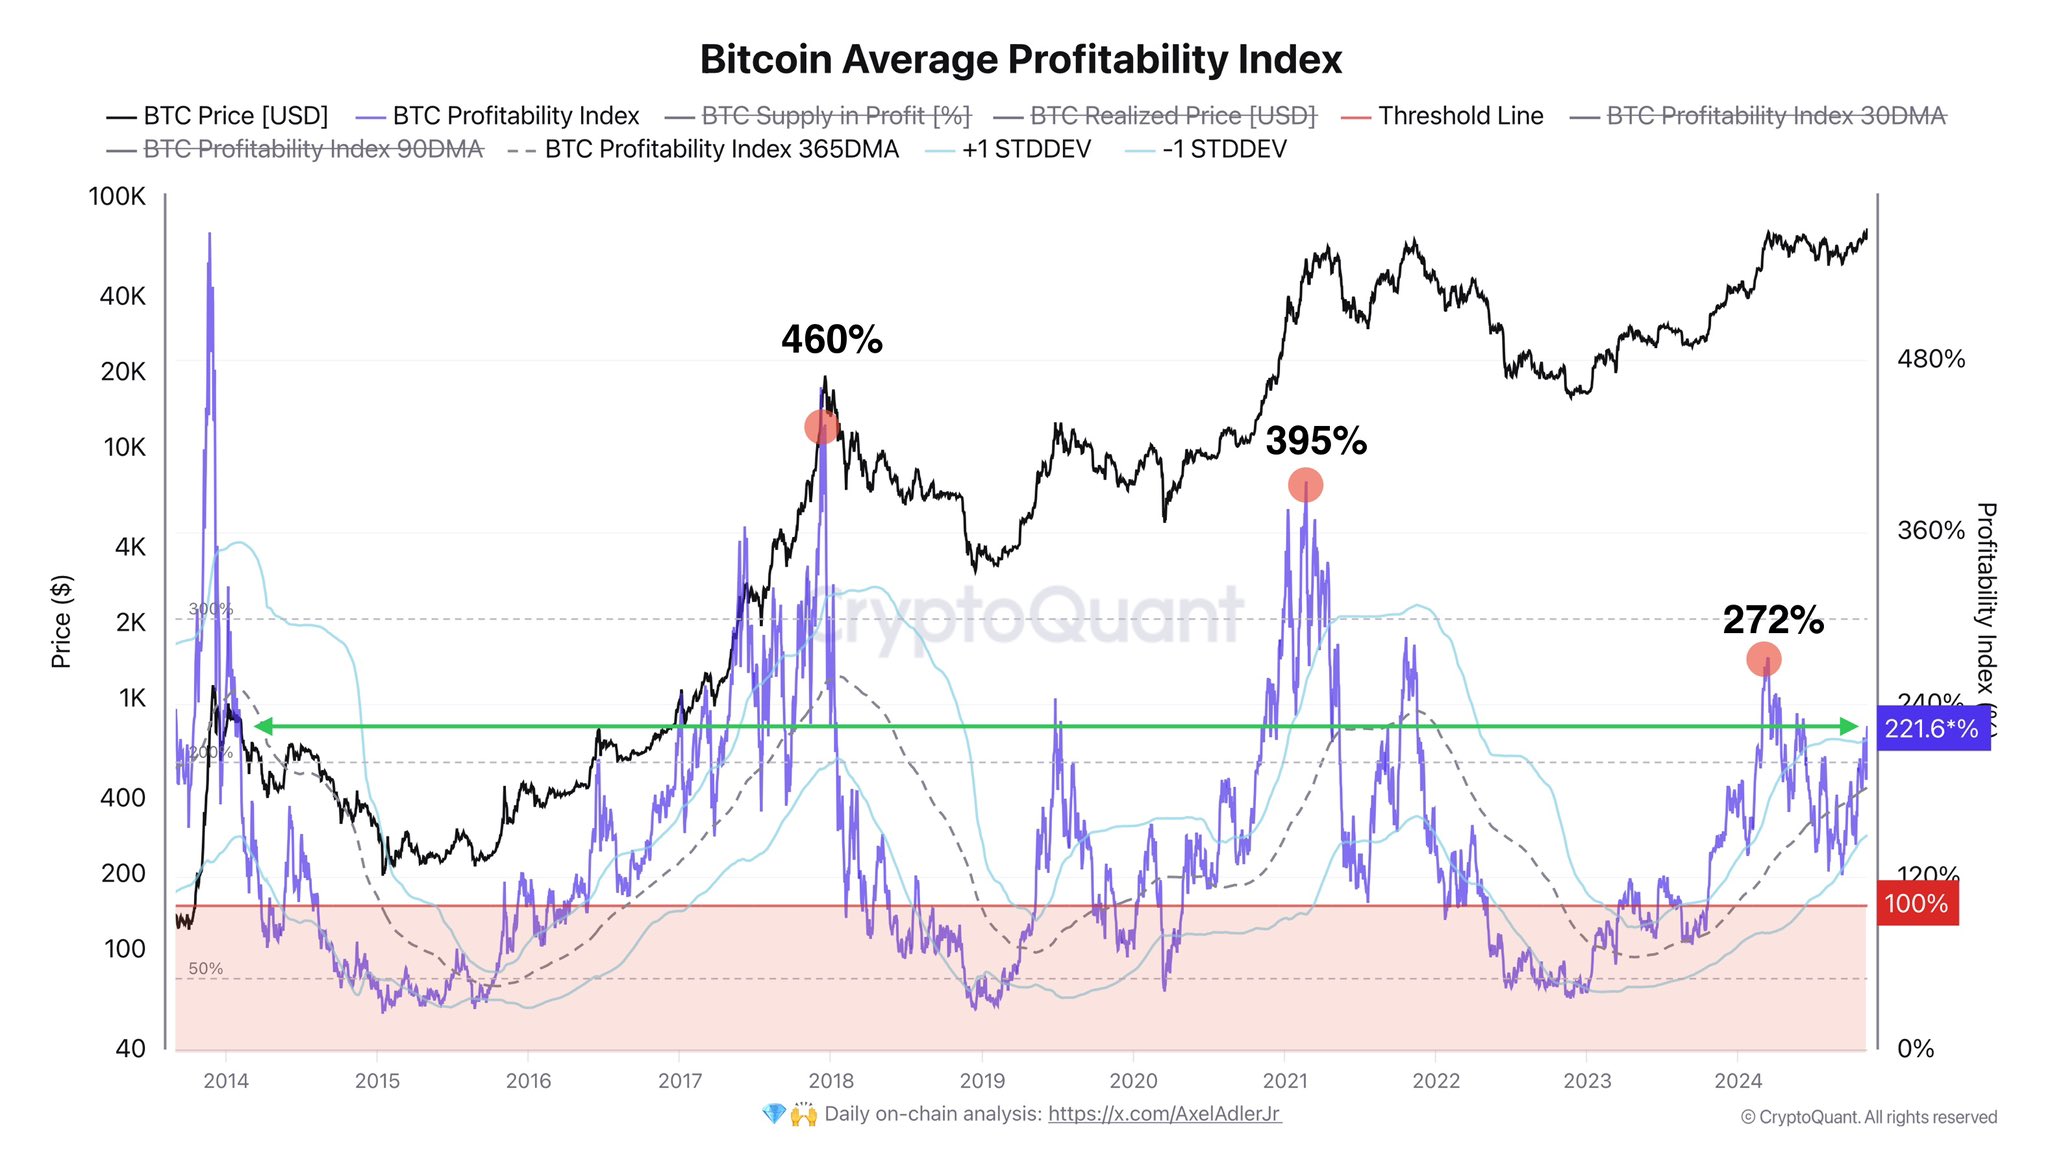
On-chain data shows the Bitcoin investors are now carrying 121% profits on average. Here’s whether this has been enough for a top in the past.
Bitcoin Profitability Index Is Currently Sitting Around 221%
In a new post on X, CryptoQuant author Axel Adler Jr has discussed about the latest trend in the Bitcoin Average Profitability Index. The “Average Profitability Index” is an indicator for BTC that compares the asset’s spot value with its realized price.
The “realized price” here refers to a measure of the cost basis or acquisition value of the average investor in the Bitcoin market. This metric’s value is determined using on-chain data, with the last price at which each coin in circulation was transacted on the blockchain being taken as its current cost basis.
When the Average Profitability Index is greater than 100%, it means the spot price of the cryptocurrency is currently higher than its realized price. Such a trend suggests the average investor is holding a net amount of profit.
On the other hand, the indicator being under this threshold implies the BTC market as a whole is carrying coins at a net unrealized loss. Naturally, the index being exactly equal to 100% indicates the holders as a whole are just breaking-even on their investment.
Now, here is a chart that shows the trend in the Bitcoin Average Profitability Index over the past decade:
As is visible in the above graph, the Bitcoin Average Profitability Index has registered a notable increase recently as the cryptocurrency’s run to the new all-time high (ATH) price has occurred.
The indicator has now reached a value of around 221%, which suggests the investors are in a significant amount of gains. More particularly, the BTC addresses as a whole are in a net profit of 121%.
Generally, the higher the profits of the holders get, the more likely they become to fall to the allure of profit-taking. The current Average Profitability Index level is high, but it’s uncertain if it’s high enough for a mass selloff to become a risk.
In the chart, the analyst has marked how high the metric went at the time of the tops of the previous bull runs. It would appear that 2017 peaked at 460%, while 2021 at 395%.
So far in the current cycle, the highest that the index has gone was 272%, which happened during the top back in March of this year. Given the fact that the indicator is yet to hit this level, let alone the peaks from the last cycles, it’s possible that Bitcoin still has sufficient room to run, before a top becomes probable.
BTC Price
At the time of writing, Bitcoin is trading around $76,200, up more than 9% over the past week.


