
The Bitcoin price started this week on a high in what was an unprecedented move for many market participants. After spending the early days of October to disappoint investors, the Bitcoin price banged over $66,000 for the first time in many weeks.
Interestingly, this price action has seen the Bitcoin price once again approaching a critical technical level with the 200-day moving average. Historically, breaking above this key indicator has signaled the start of explosive rallies, often resulting in parabolic price increases. The question now is can Bitcoin repeat this historical pattern and ignite another massive surge?
Bitcoin Price Approaches The 200-MA. What Does This Mean?
The 200-day moving average provides a clear view of an asset in the long term. A break above the 200-day moving average suggests the cryptocurrency is now trading for a positive difference compared to an average over 200 days. For Bitcoin in particular, this indicator has often served as a tipping point between bullish and bearish sentiment for its price.
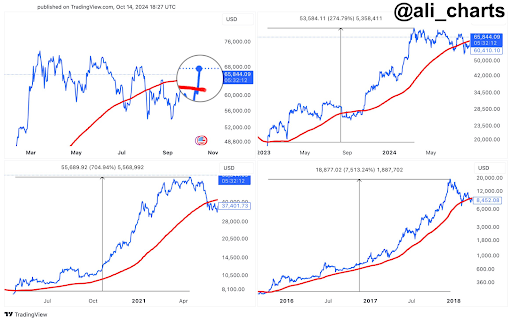
Crypto analyst Ali Martinez noted that in the past, Bitcoin’s price break above the 200-day moving average has consistently marked the onset of parabolic bull runs. The last three times the Bitcoin price broke above the 200-day moving average each kickstarted parabolic bull runs. The first time was in 2016, which saw Bitcoin continue on a 7,513% increase that lasted for almost two years.
Again, in 2021, Bitcoin’s price crossed above the 200-day moving average for the second time, which led to a 705% price increase that peaked in April 2021. Most recently in 2023, Bitcoin’s price broke above the 200-MA for the third time, sparking yet another significant price rally. This time, Bitcoin saw a 275% increase from its breakout level.
These previous instances show the importance of the 200-day moving average for bullish price action. Recent price action has seen the Bitcoin price break slightly above the 200-day moving average again, which is currently situated around $65,844. Consequently, this price point has now become a major point of interest for both bullish and bearish traders.

What’s Next For BTC Price?
The Bitcoin price reached as high as $66,000 in the past 24 hours, although it has retraced a bit and is now trading just below. A reconfirmation above the $66,000 would finally cause a break above the 200-day moving average and potentially kickstart another bull rally.
As Bitcoin attempts to break above this key level, all eyes are on whether it can replicate the parabolic moves seen in previous cycles. However, the price returns have each reduced time in the last three breakouts.
Nonetheless, even a return between 100% and 150% would translate to a price target between $132,000 and $165,000 from the current price. Bitcoin could also easily break out of the 200-day moving average and reach these price points quickly, especially with growing institutional inflows through Spot Bitcoin ETFs.