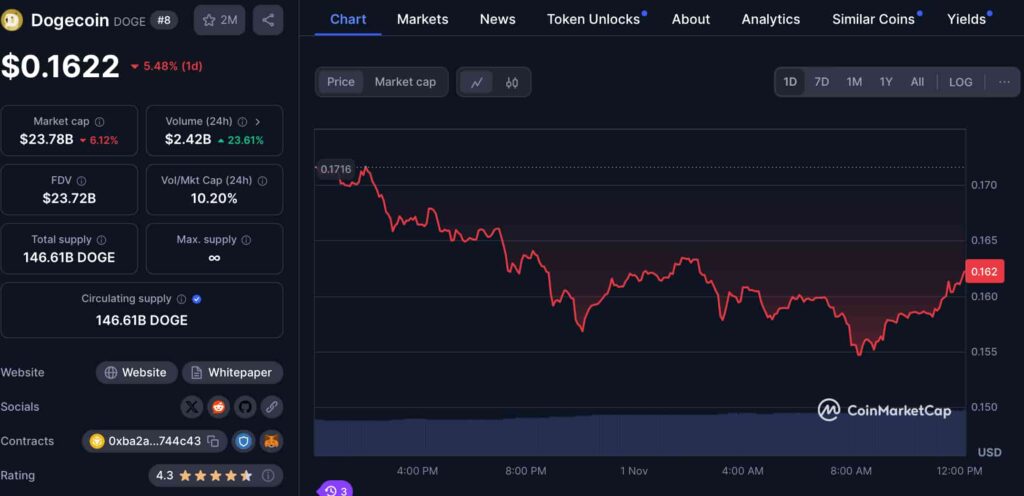
Currently priced at $0.1606 after a 5% fall on the 24-hour chart, Dogecoin (DOGE) still has surged 50.10% over the past month and climbed 16.36% in the last week.
Over the past year, Dogecoin has outpaced Bitcoin and Ethereum with an impressive 129% gain, outperforming 69% of the top 100 crypto assets by market capitalization.

The meme coin’s bullish setup has become the talk of analysts and traders, fueled by strong technical indicators. Trading above its 200-day simple moving average—a key level that often signals sustained momentum—DOGE has shown resilience with 19 green days out of the past 30.
This stability in upward movement, combined with high liquidity, sets the stage for a potential breakout beyond current resistance levels.
DOGE’s parabolic potential
Dogecoin’s monthly chart is displaying a classic “Falling Wedge” pattern, identified by trader and analyst Trader Tardigrade. Known for its predictive strength in technical analysis, the Falling Wedge pattern is often seen as a bullish reversal signal, particularly when followed by a breakout as observed here.
“Parabolic move is following the falling wedge breakout,” Tardigrade stated, hinting that DOGE could be preparing for a powerful upward trajectory. In technical trading circles, this breakout pattern has been historically associated with rapid price escalations as market sentiment shifts from consolidation to accumulation.
Market experts predict next leg higher for DOGE
Several seasoned analysts are pinpointing technical levels that could serve as launchpads for the next big rally. Altcoin Sherpa, a respected voice in crypto trading circles, has stated, “If you get an entry at $0.16 for $DOGE, you will make a lot of $$ imo.”
Suggesting a setup at $0.16 is a solid foundation for traders to accumulate positions in anticipation of higher moves.
Supporting this bullish outlook, AMCryptoAlex noted that DOGE recently pumped 70% within three weeks before retracing by 15%, indicating a healthy consolidation that could precede another surge. As Alex sees it, Dogecoin is “preparing for the next leg up,” with a target around the $0.20 mark.
This classic pattern—where a sharp price spike is followed by a controlled pullback—often indicates that buying pressure is absorbing selling interest, setting the stage for further gains.
Dogecoin approaches Golden Cross
Perhaps the most significant technical development on the horizon is Dogecoin’s potential “Golden Cross,” a pattern in which a shorter-term moving average crosses above a longer-term moving average.
This signal, often viewed as a precursor to sustained rallies. Analyst Elja noted, “$DOGE Golden Cross Approaching. Last time this happened, DOGE pumped 21,000% in just 5 months.”
In a market where high-frequency traders and algorithmic models quickly respond to such technical signals, a Golden Cross can attract both institutional and retail buying interest. The impending crossover could thus act as a magnet, pulling in liquidity from market participants who view it as a signal of broader bullish trends in the DOGE market.
For traders tracking this rally, several key levels are worth monitoring. Currently, Dogecoin is testing resistance around the $0.16 level, with analyst targets set around $0.20. Should DOGE break past this resistance, the next price action could push it into a new trading range, potentially signaling a larger shift in its valuation.
For downside protection, the support zone near $0.14 offers a cushion where traders may place stop-losses to limit exposure, given the high volatility typically associated with meme coins.
Additionally, with DOGE displaying robust liquidity and community-driven momentum, the setup remains favorable for those looking to capitalize on short-term moves while hedging for potential pullbacks.
Featured image:
Jiri Hera. Golden Dogecoin coin, cryptocurrency Dogecoin, Doge cryptocurrency. Digital image. Shutterstock.
The post Dogecoin price set for ‘parabolic move’, according to analyst appeared first on Finbold.

