
In a bullish trading week, Ethereum (ETH) surged by over 8% as its market price returned above the $2,600 price mark. However, amidst this rally, certain market developments have occurred which raises questions over Ethereum’s future price movements.
50,000 ETH Flow Into Derivative Exchange – Price To Rise Or Fall?
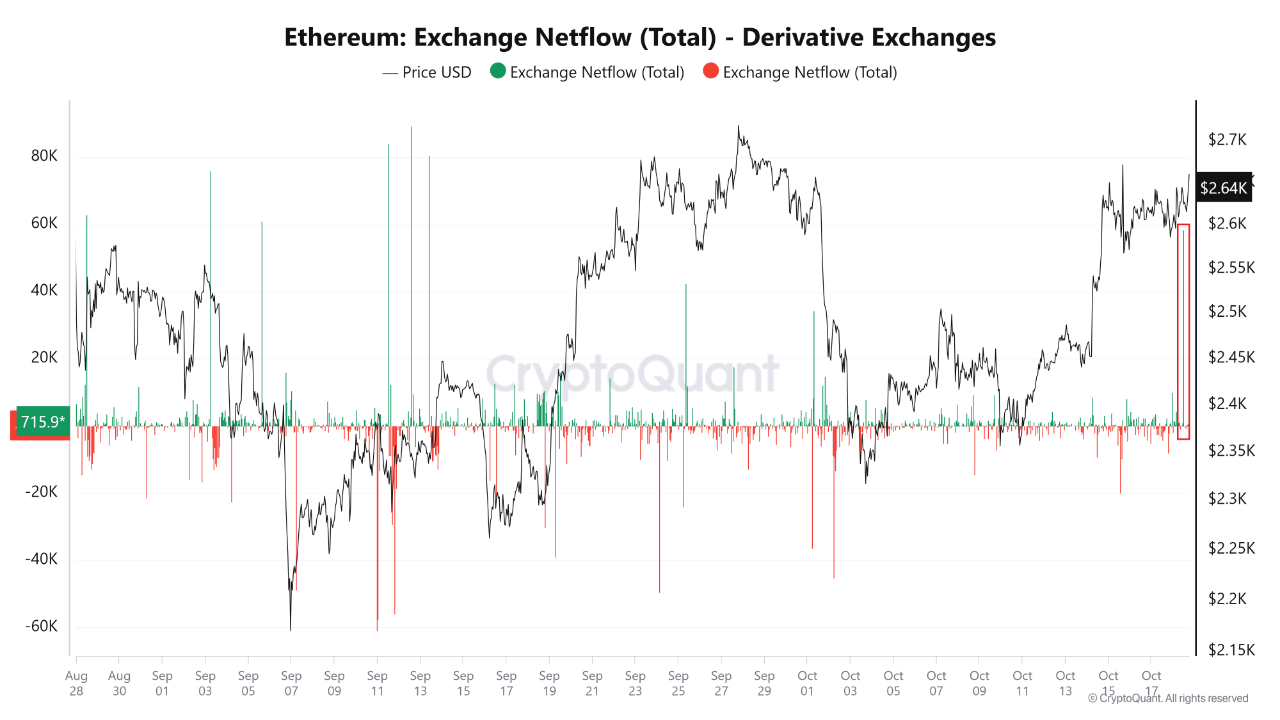
In a Quicktake post on CryptoQuant, an analyst with username Amr Taha reported there has been a positive net flow of over 50,000 ETH valued at $132.12 million on derivative exchanges. In this context, net flow measures the difference between the amount of ETH deposited and the amount of ETH withdrawn from derivative exchanges, which are standard trading platforms for products such as options and futures contracts.
Therefore, a positive net flow indicates a higher amount of ETH has been deposited than withdrawn on the last day. Analyzing the implications of this development on Ethereum’s price, Amr Taha has postulated two situations.
First, the analyst states that a positive net flow to derivative exchanges could indicate a potential rise in selling pressure as traders may be looking to offload their ETH either by opening a short position or selling through a futures contract at a predetermined price. Alternatively, a positive net flow may indicate that traders are depositing ETH to use as collateral for margin or future contracts betting that the price of ETH will rise, thus expressing confidence in the token’s profitability.
Essentially, this massive positive ETH net flow holds significant potential to swing Ethereum’s price either way based on traders’ actions.
Ethereum Prepares For Encounter With Crucial Resistance
In other news, Ethereum continues to trade at $2,636 reflecting gains of 1.11% and 12.89% in the last one and 30 days respectively. Meanwhile, the token’s daily trading volume is up by 12.89% and is valued at $17.06 billion.
However, despite these positive metrics, data from CoinMarketCap shows that market sentiment towards the altcoin is largely bearish as investors perhaps anticipate a price retracement following the ETH’s recent gain in the last week. Interestingly, the Ethereum daily chart shows the token is approaching a key resistance level at $2,700 which has served as a strong rejection zone over the last two months.
Albeit, the relative strength Index is still some significant distance away from the overbought zone indicating Ethereum’s price rally may be far from over and may break past this resistance level. In addition, analysts have observed an ascending triangle pattern on the ETH hourly chart indicating strong bullish potential to surge past $2,700 reaching as high as $2,870 in the coming days.