
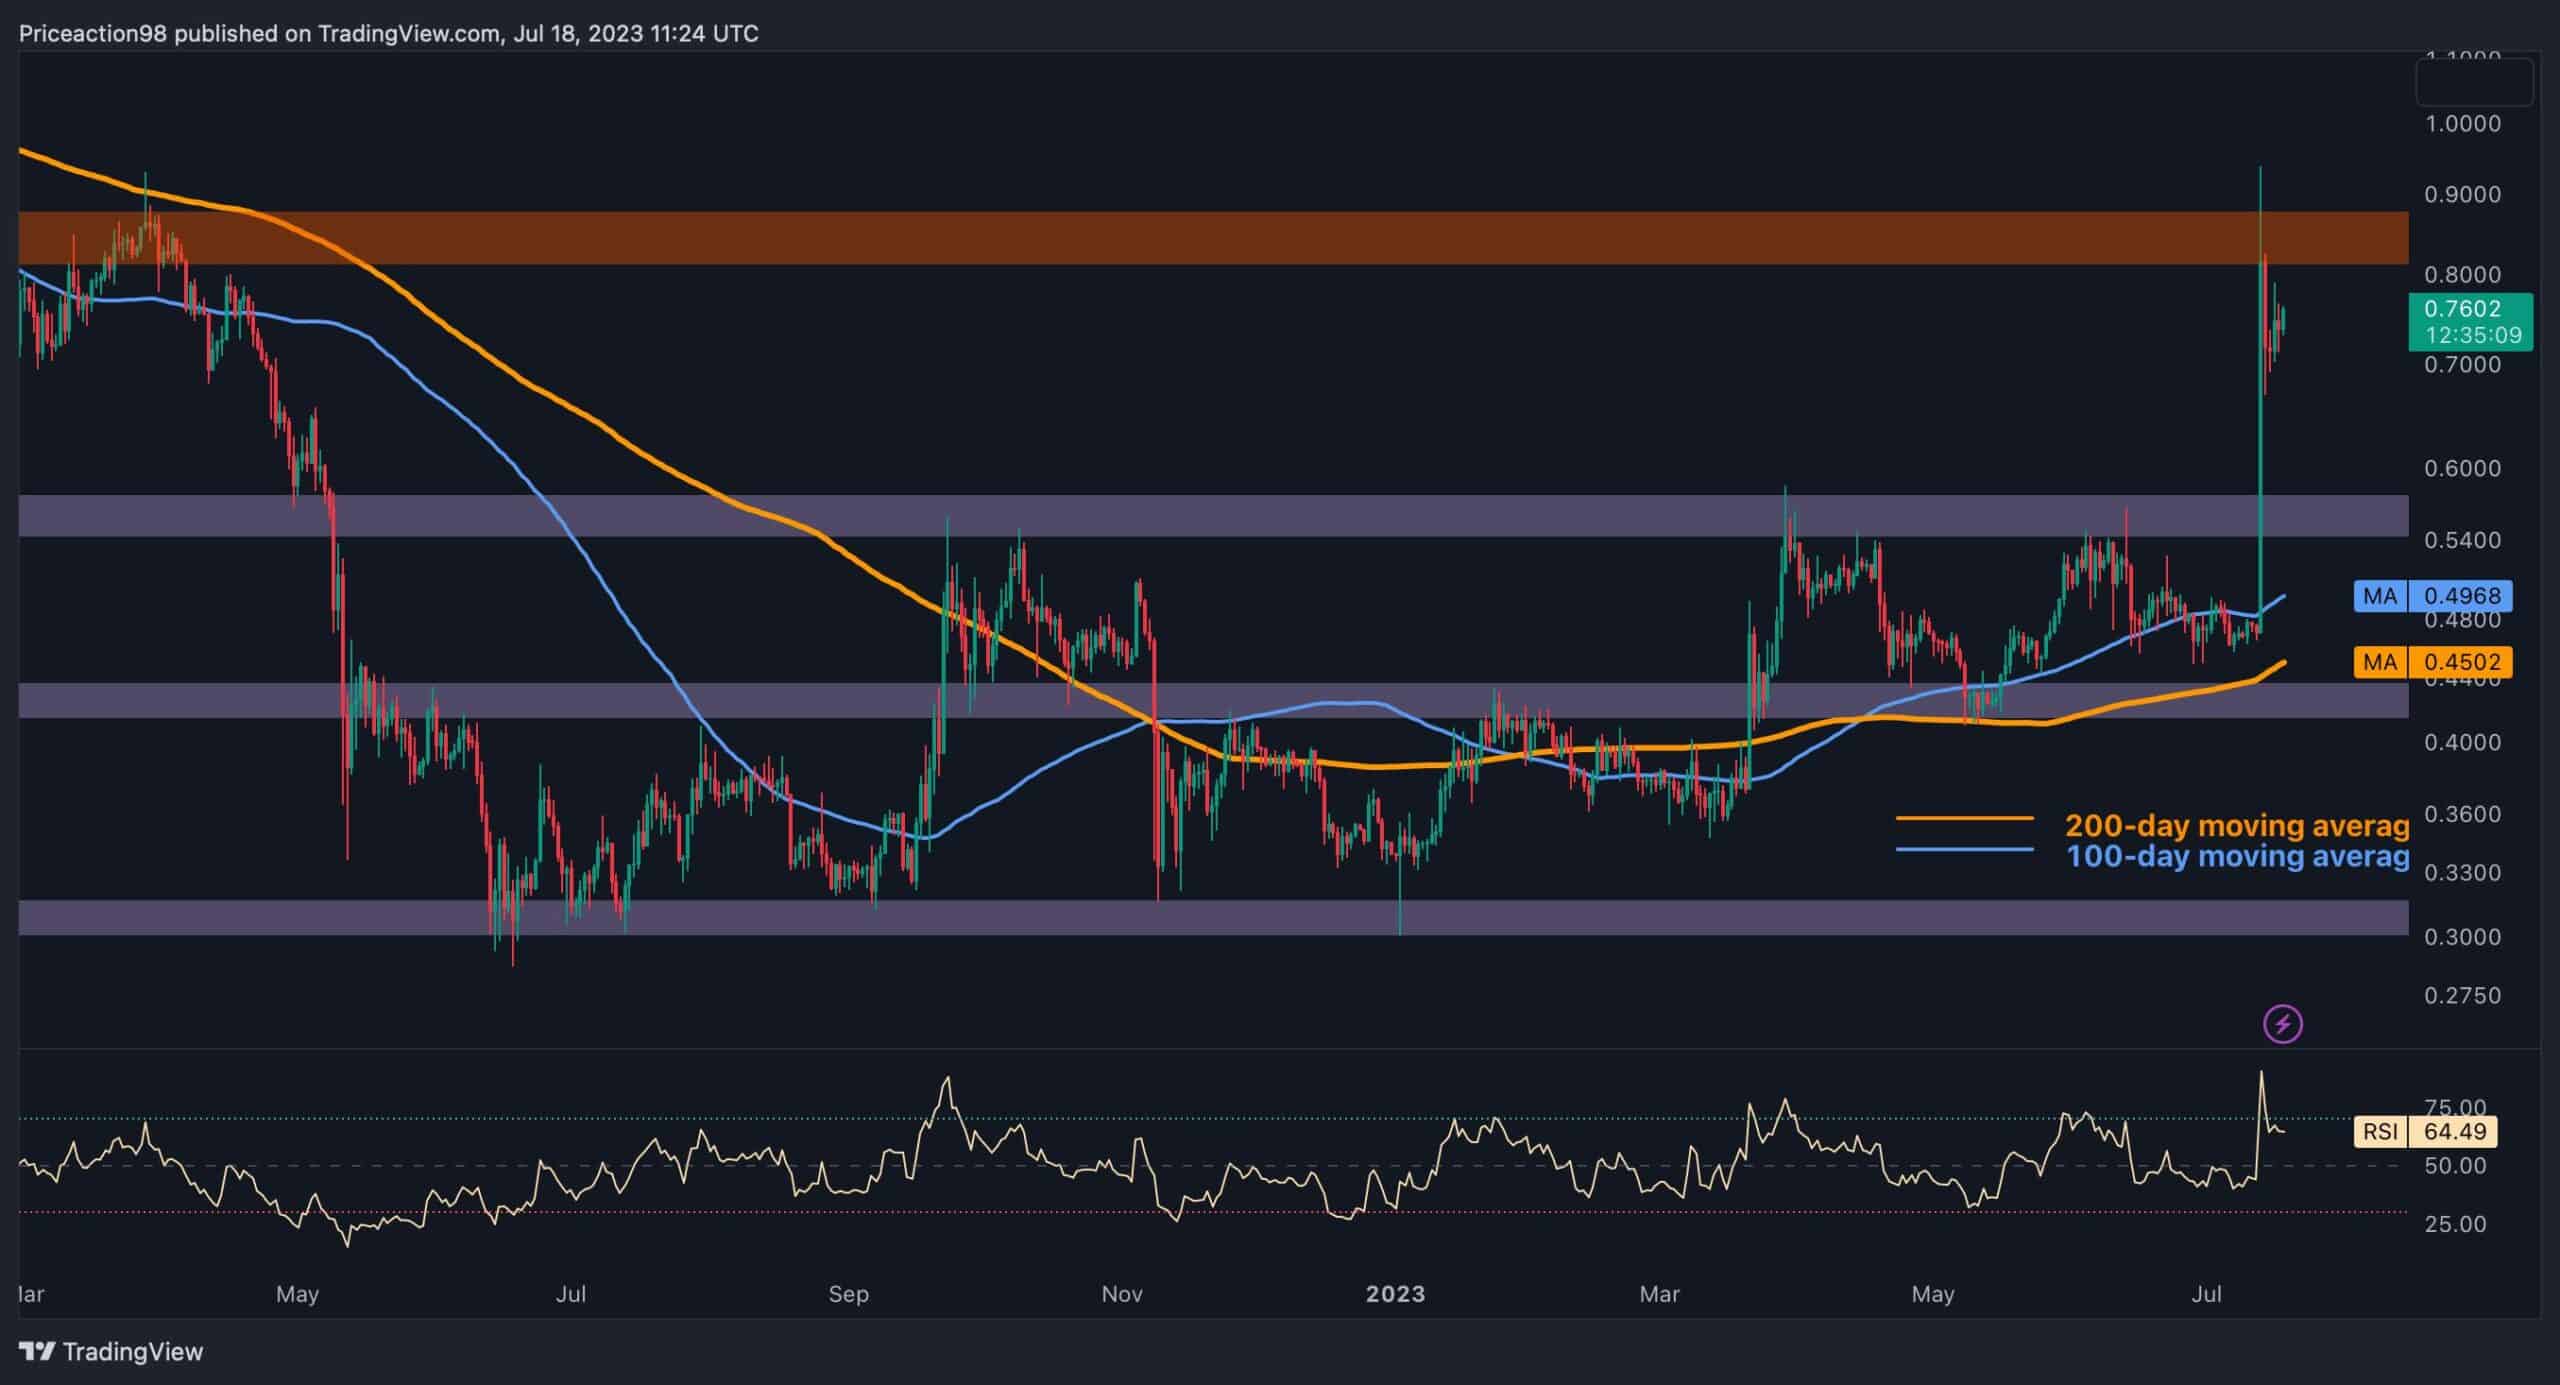
Ripple’s price has experienced a significant surge after finding strong support around the 100-day moving average at $0.497. It is now approaching a crucial resistance level at $0.85, indicating a prevailing buying pressure in the market and a positive outlook for Ripple’s medium-term prospects.
Ripple Price Technical Analysis
By Shayan
The Daily Chart
Analyzing the daily chart, it is apparent that the XRP price increased after finding support at the 100-day moving average. However, it now faces a strong resistance zone at $0.85, characterized by high selling pressure and increased supply.
This development suggests a bullish sentiment among traders, increasing the likelihood of a breakthrough above the resistance region. However, it’s important to note that every significant upward movement is typically followed by a consolidation or correction phase, and Ripple’s price is no exception.
Therefore, it seems likely that the price will enter a short-term correction phase, accompanied by higher volatility and pullback periods before the next significant upward movement occurs.
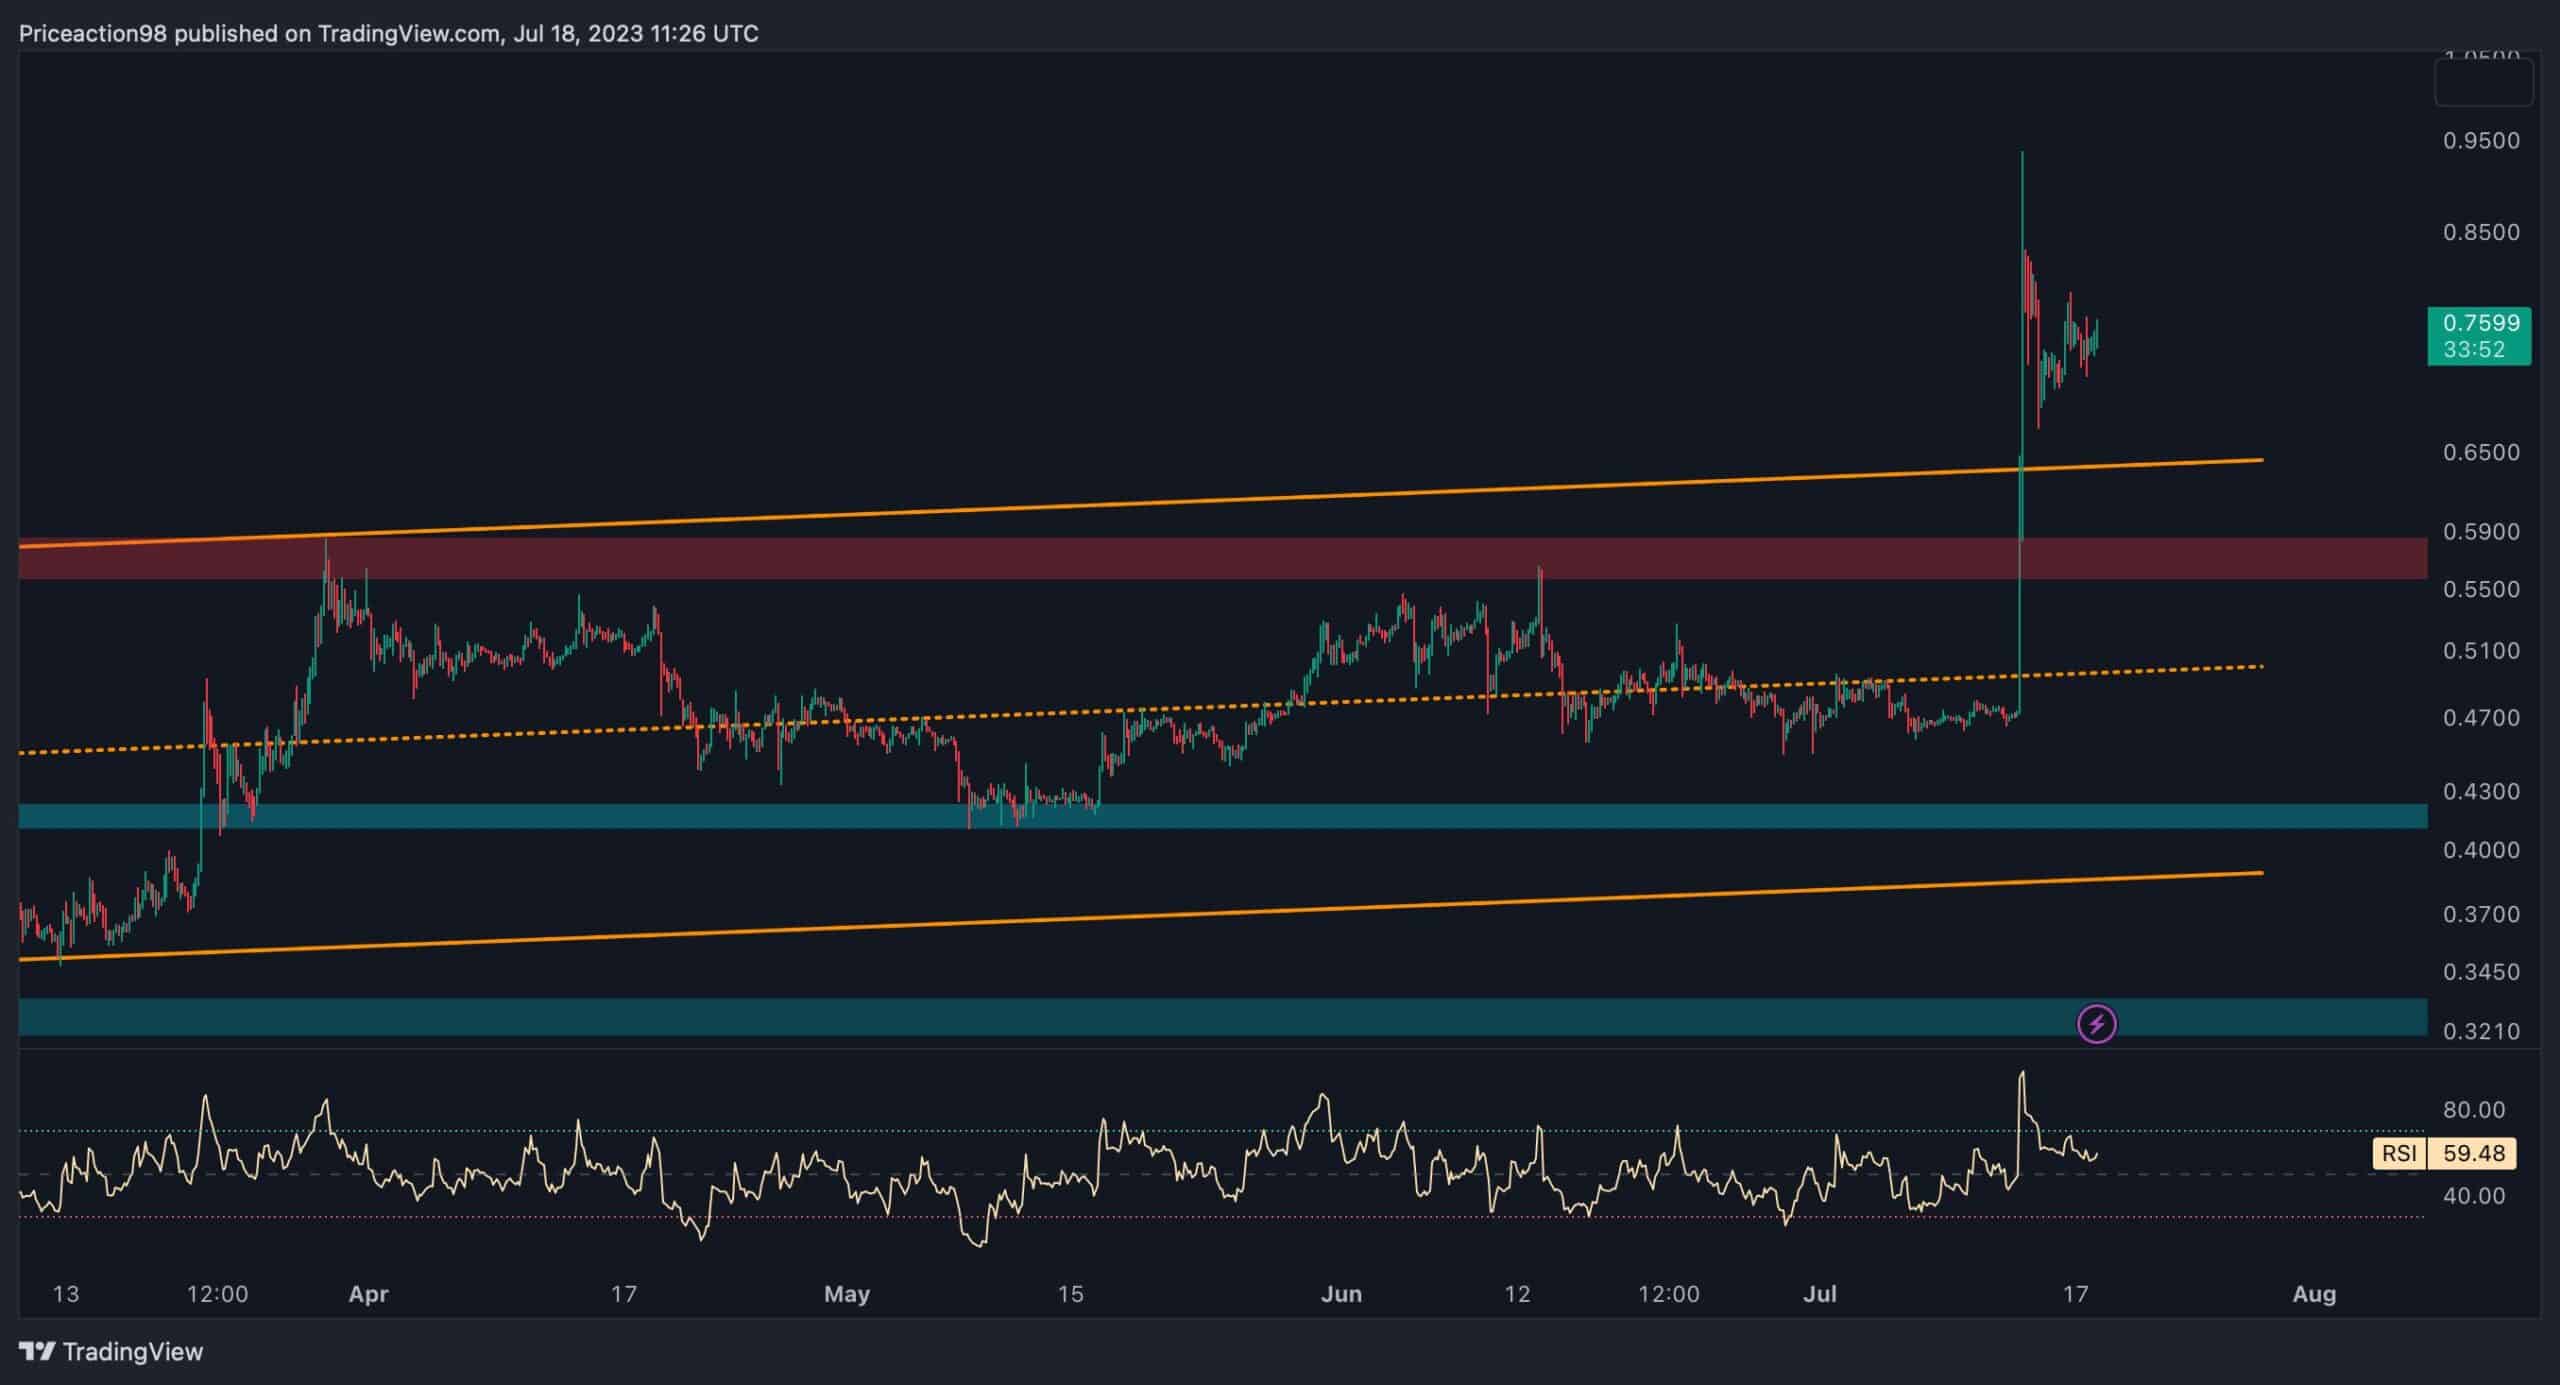
The 4-Hour Chart
On the 4-hour chart, it can be seen that the price has successfully broken above the upper edge of a channel, evidenced by a large green candle resulting from a recent explosive rally. However, for a valid breakout confirmation, a pullback to the broken level should occur.
Therefore, based on the price action, it appears more likely that the price will retrace back to the upper boundary and complete a pullback. If this occurs, the market can expect the bullish rally to continue, reaching higher resistance levels.
However, in the event that the recent breakout proves to be false, Ripple may face significant rejection and a subsequent decline.
The post XRP Price Analysis: Can Ripple Bulls Push Toward $1 or is a Correction Imminent? appeared first on CryptoPotato.